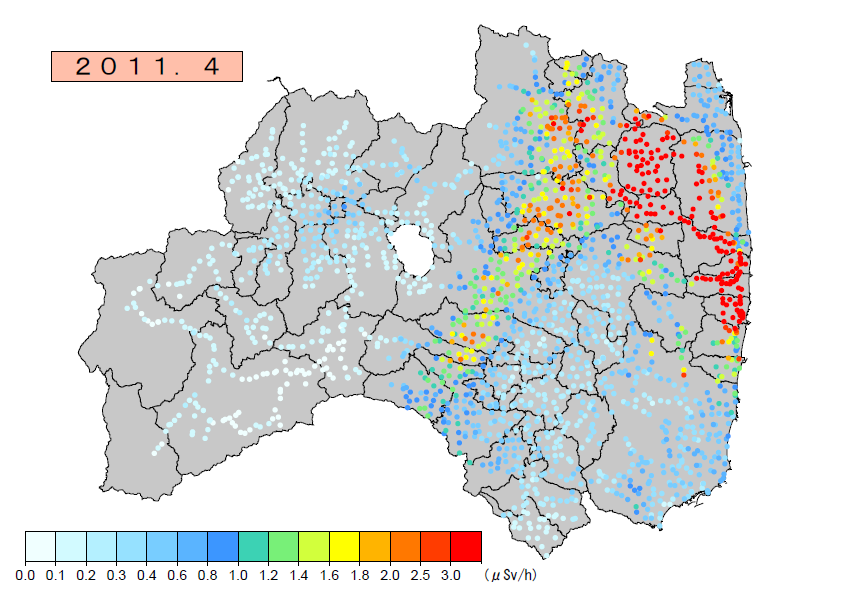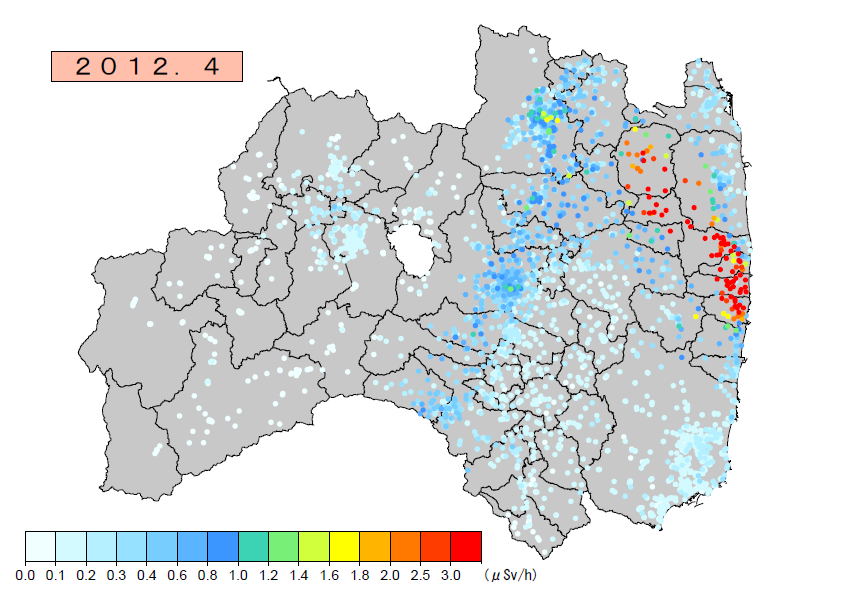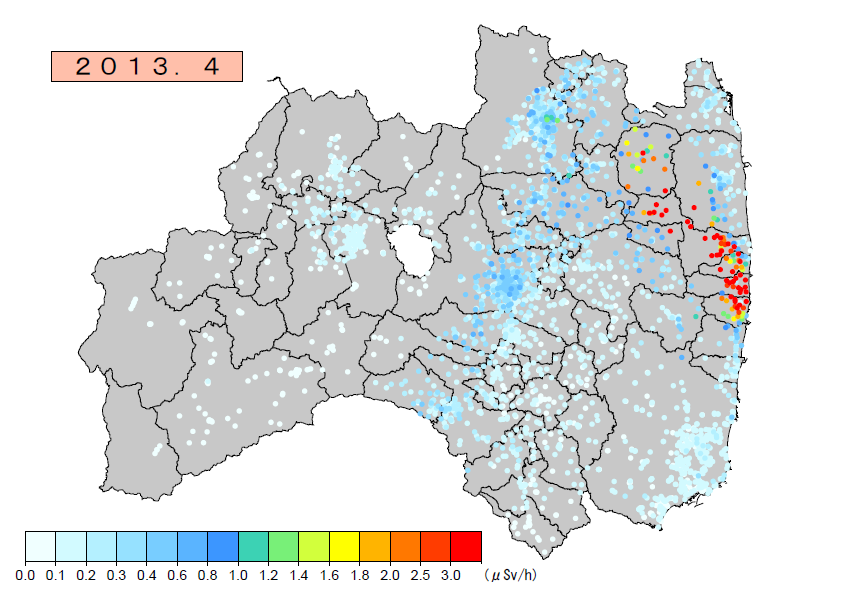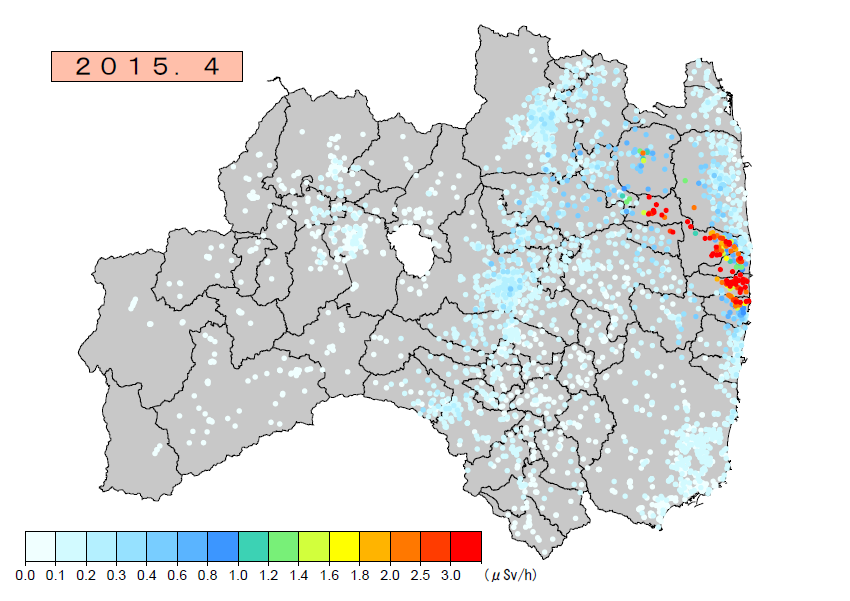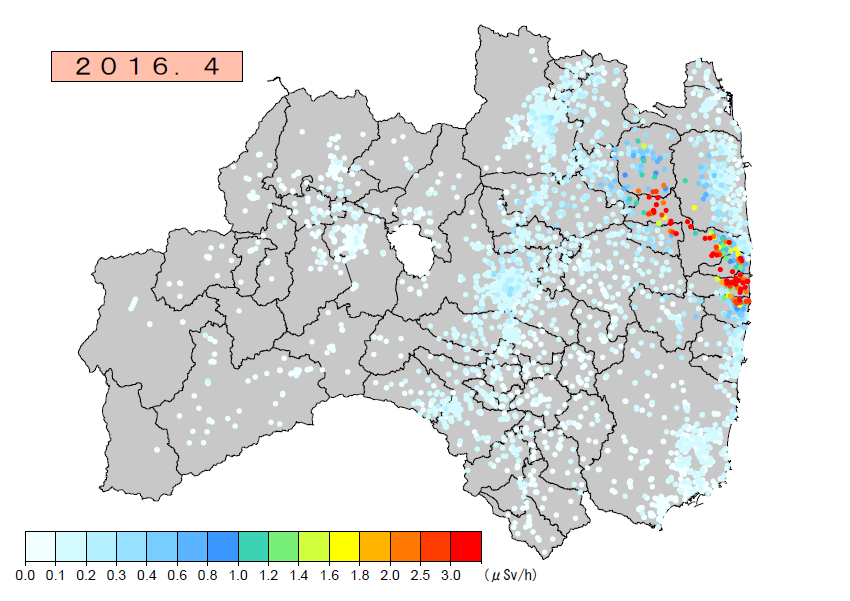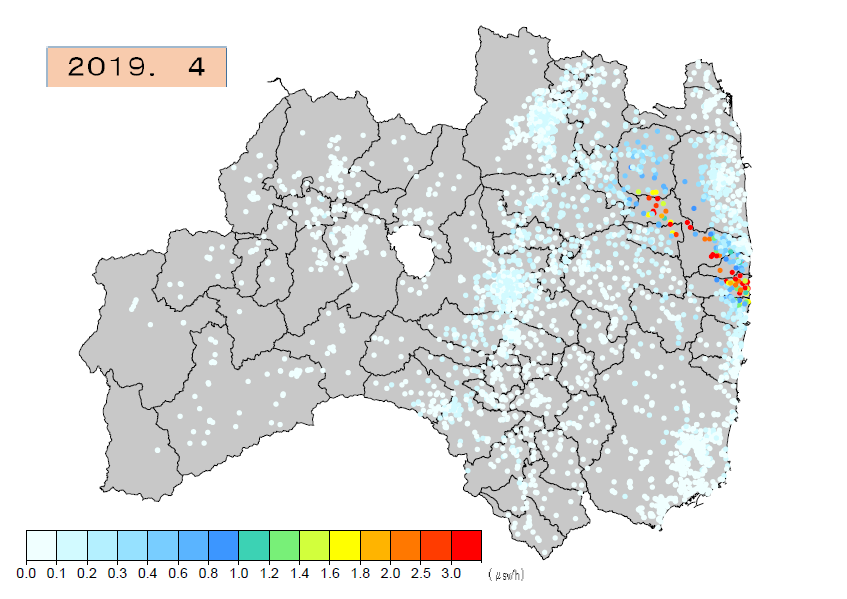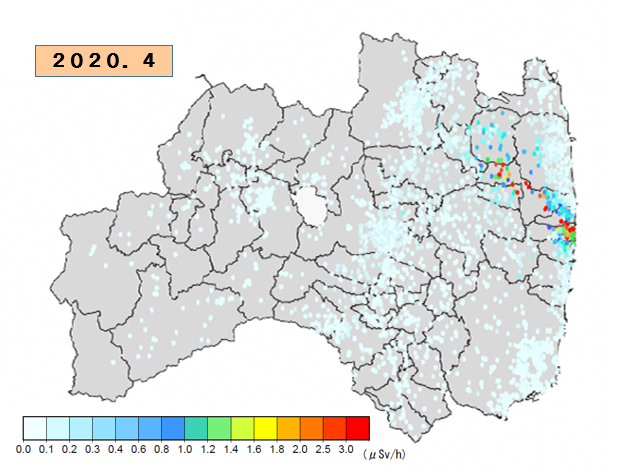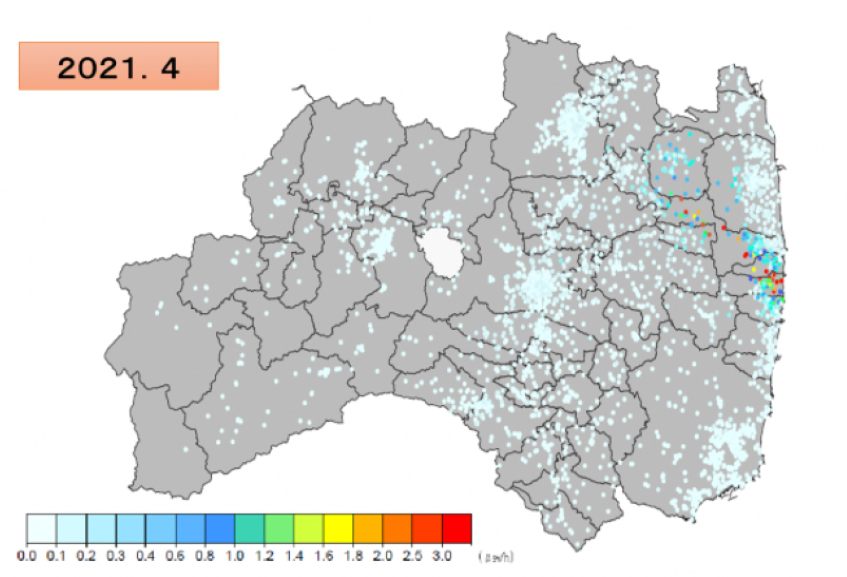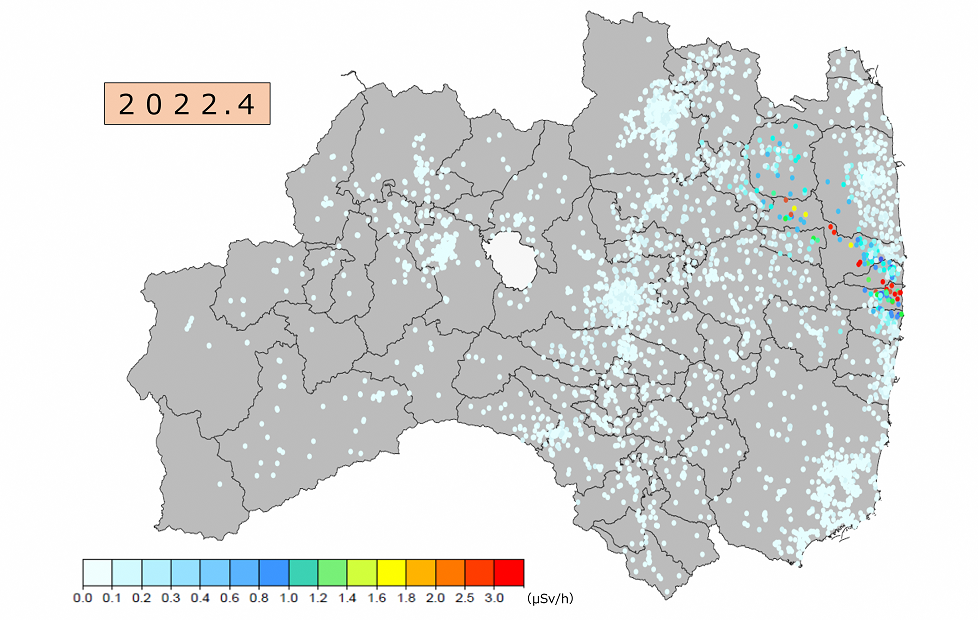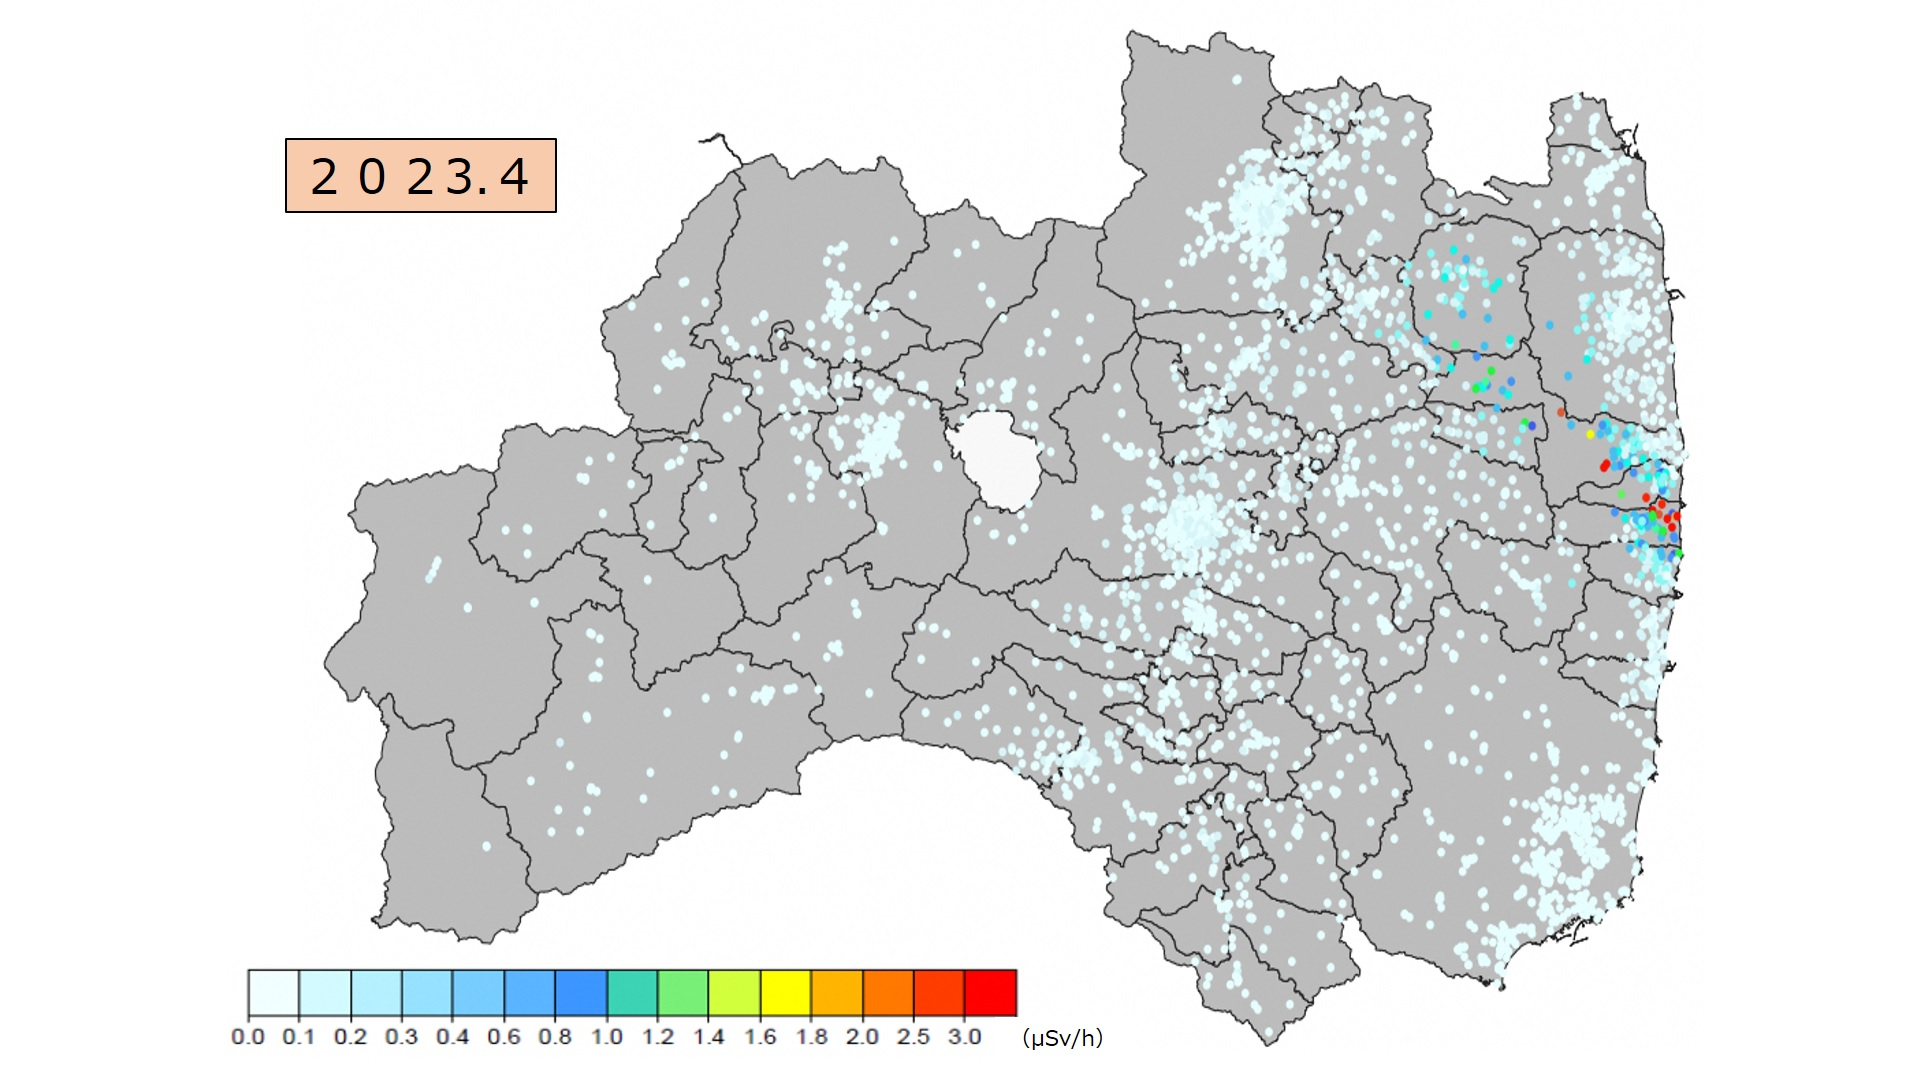
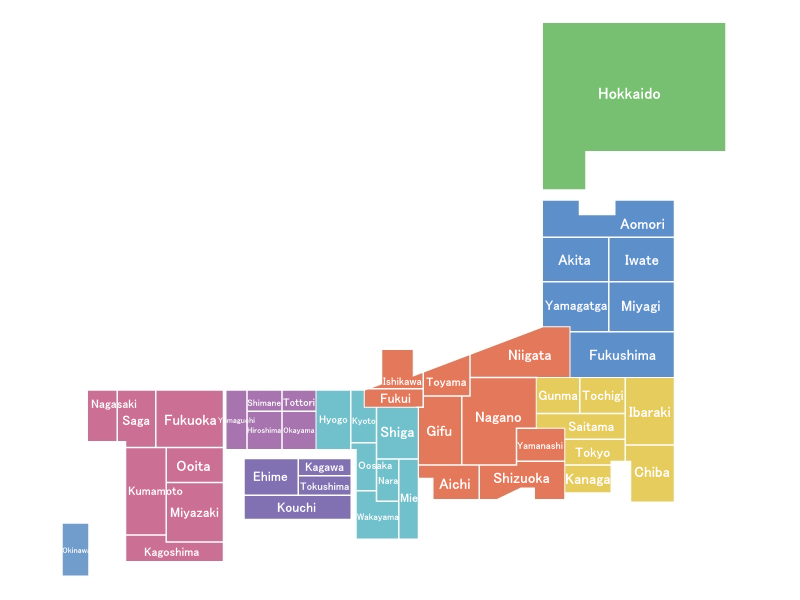
See the radiation map of Fukushima Pref.
検索結果
| 地点名 |
|---|

|
|
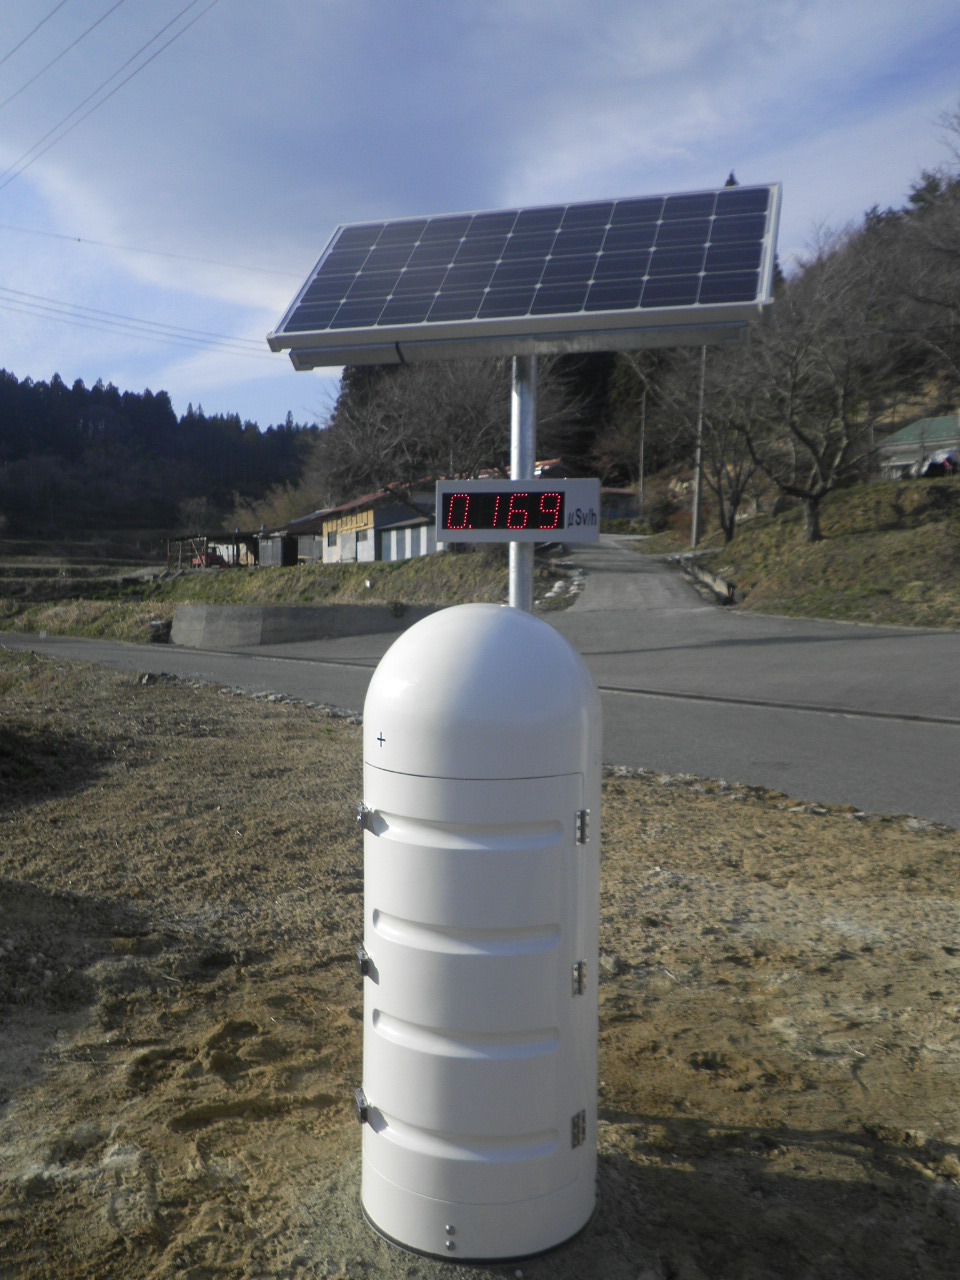
放射線量 |
|
|
原発事故前の県内の放射線レベルの範囲 (平成12~21年度、県内13箇所の上限・下限値) |
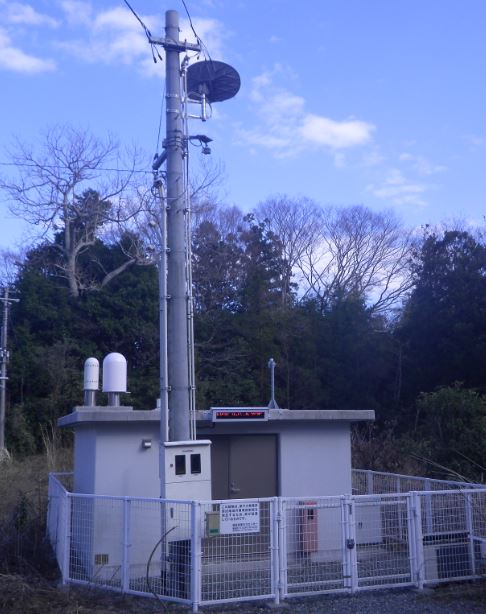
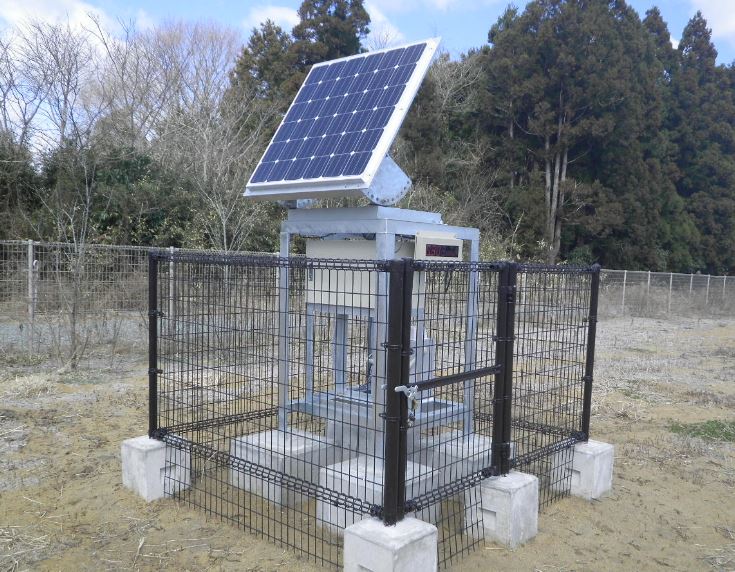
| No | City name | Monitoringpost(M) | Realtime dosimetry system(R) |
|---|
| No | point name | The date of the measurements | Air dose rate |
|---|